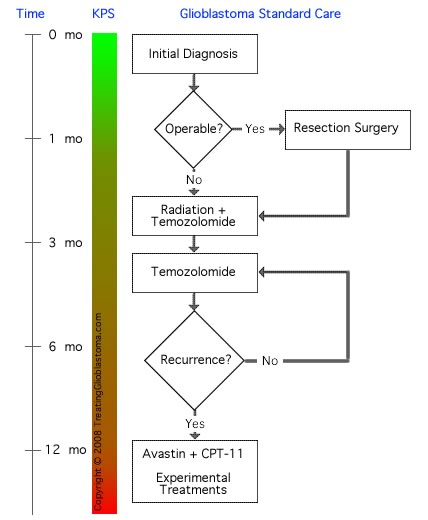
Standard Treatment Flow Chart

This illustration charts the course of current, standard glioblastoma brain tumor treatment, beginning at diagnosis and running through the first year. The flow chart is chronological, beginning at the Initial Diagnosis at the top and proceeding down to the end of the first year at the bottom of the illustration. Note that the Time scale is not linear in this illustration. The green-to-red colored gradient represents an approximate Karnofsky Performance Status (KPS) corresponding to the Time scale and a typical glioblastoma disease progression, ranging from green (KPS = 100) to red (KPS = 50 or lower).
